Debugging PowerShell in VSCode
by Aaron Crowder on in Programming Tools
Yesterday I learned a neat trick with Visual Studio Code when working on some PowerShell scripts to help orchestrate build and deployment of our projects (more on that in a different post). I knew that VSCode had a debugger, but I didn’t realize that a debugger for PowerShell had been added via an extension.
I had installed this extension some time ago to help with writing PowerShell scripts in VSCode, but I was running my PowerShell prompt in another window to actually test them. I realized that I could debug my PowerShell scripts in VSCode so I set it up and tried it immediately. AND IT’S AWESOME.
To enable it open up a folder with you PowerShell scripts in it, go to the debug
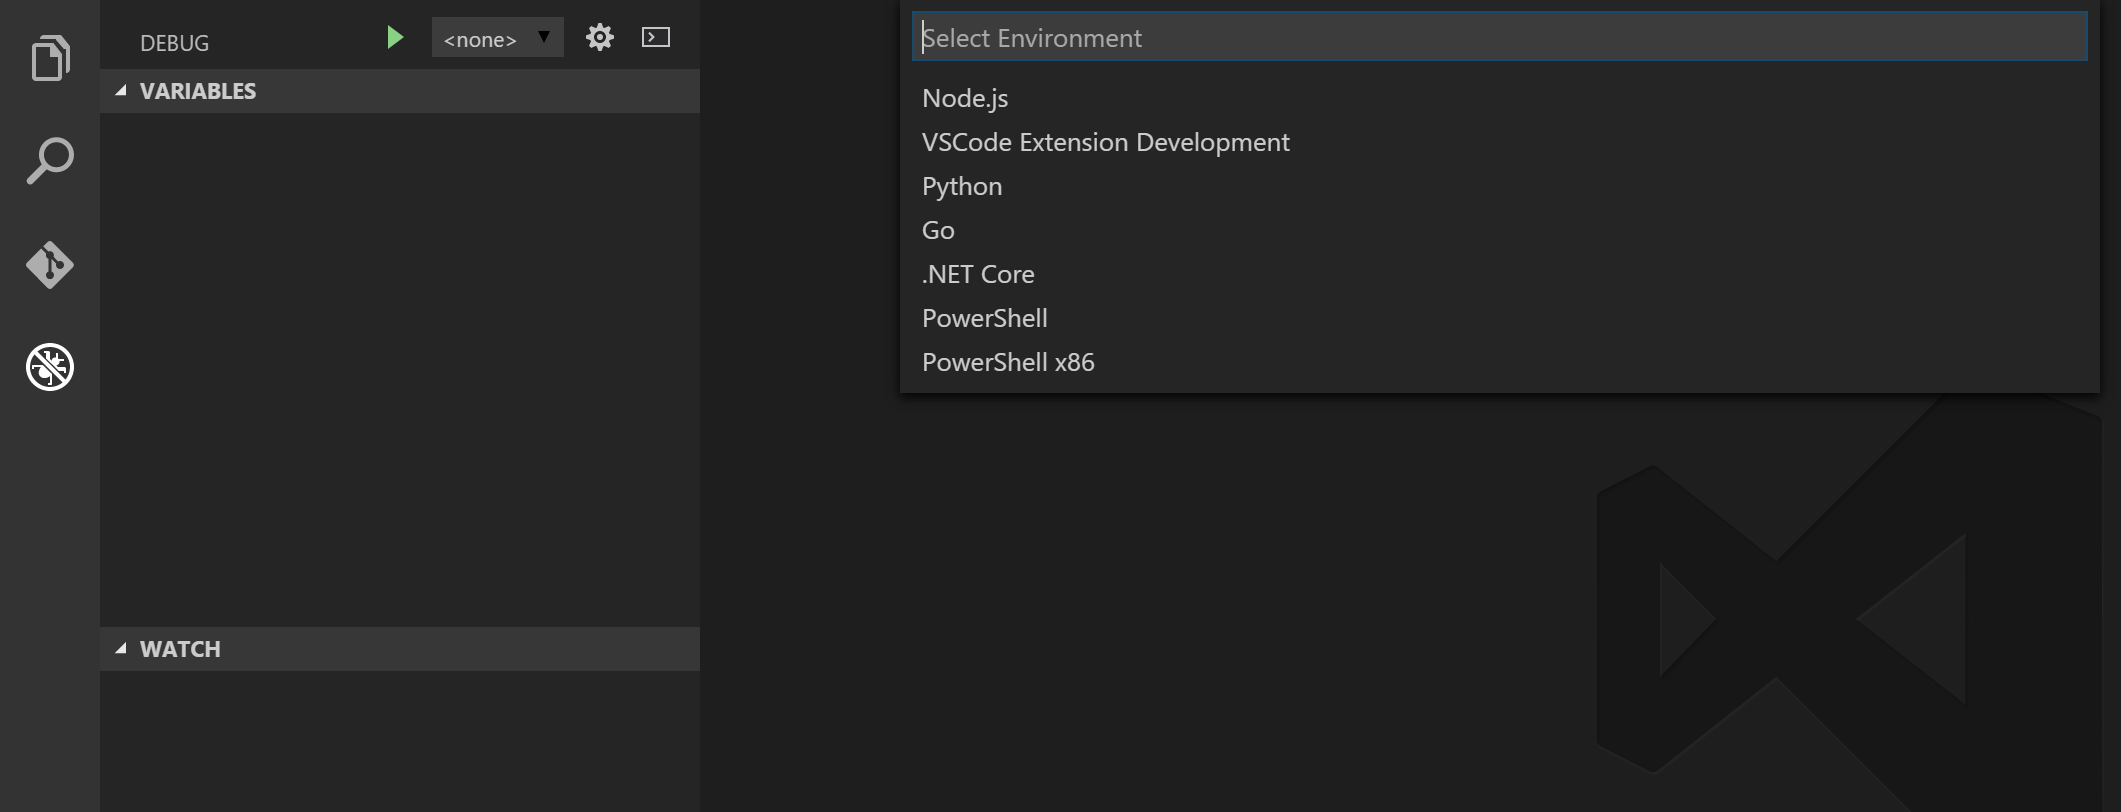
tab, click on the gear and select “PowerShell”. If you don’t already have a
.vscode/launch.json file it will create one with the right settings. Then you
just have to open a PowerShell script, hit F5 and away you go!
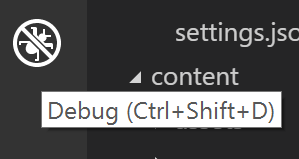
Here’s the steps:
1. Open the Debug Tab
2. Click the gear and select “PowerShell” from the dropdown
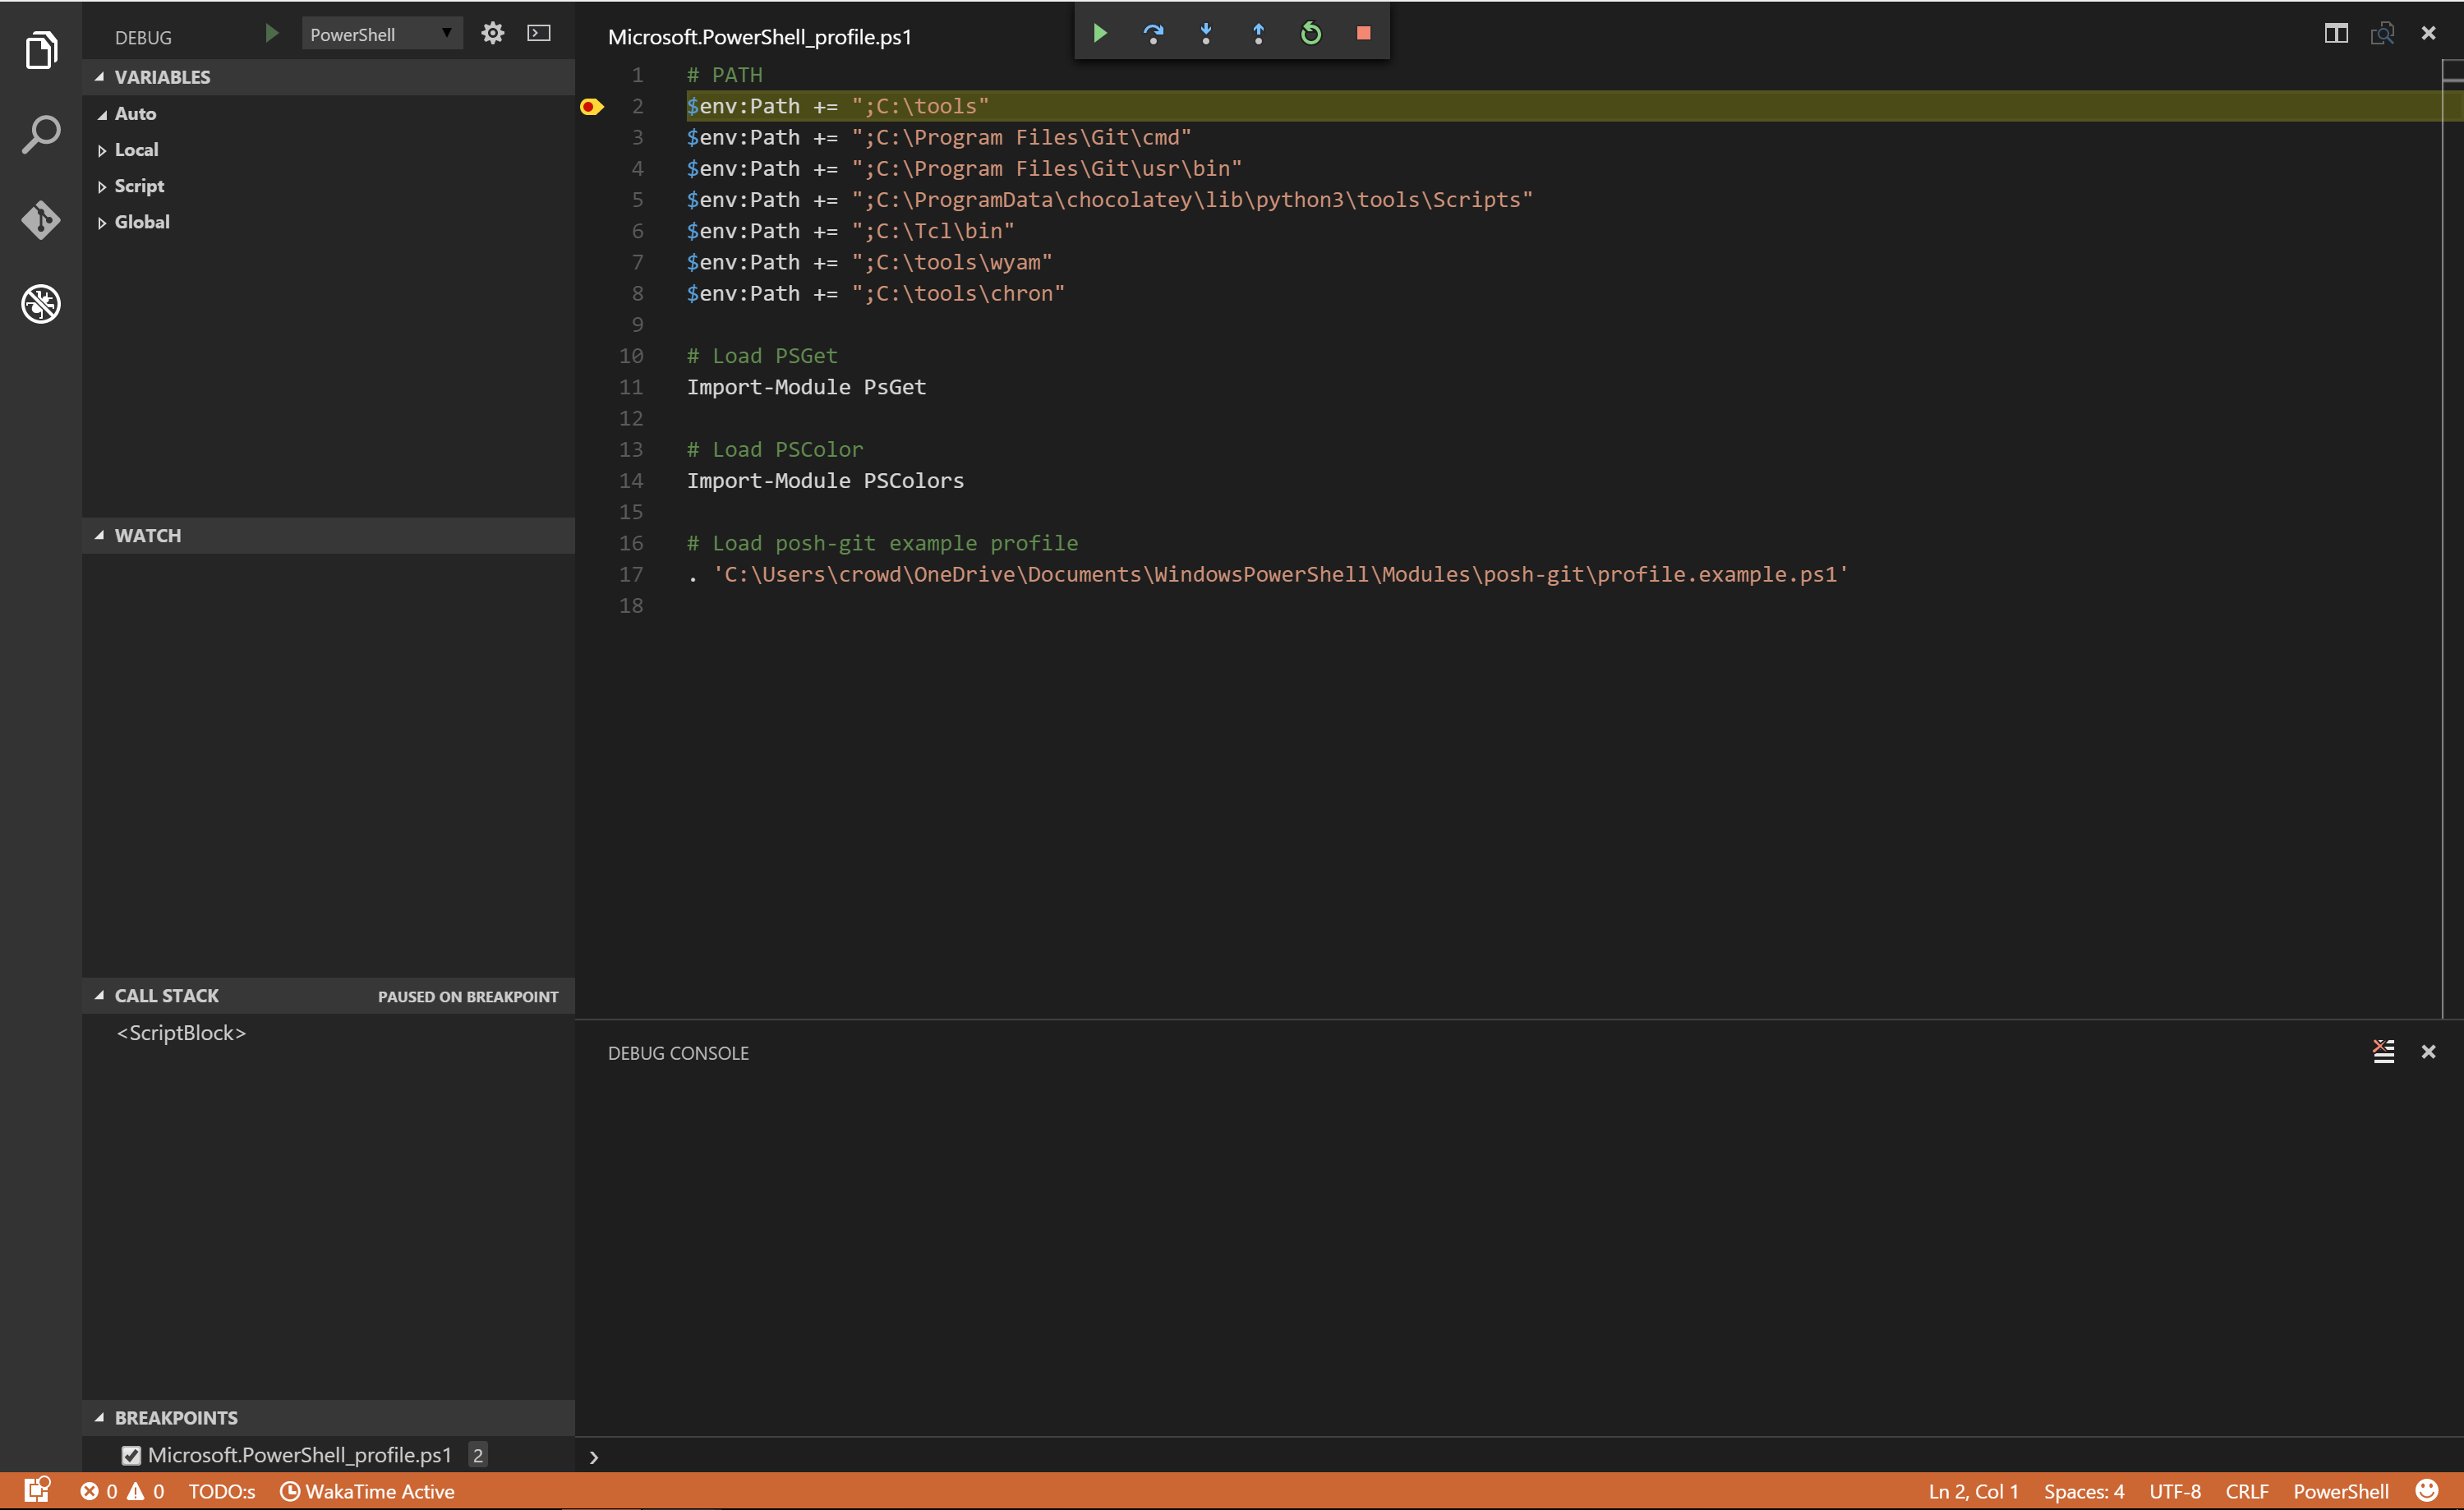
VSCode has been awesome to work with (I’m using it to write this post!). Having a built in debugger with a light-weight and extensible text editor has been really cool! You can set a breakpoint really easily by clicking in the gutter to the left of the line number (just like in any good debugging tool). Here’s what it looks like when you are actually debugging (this is actually my PowerShell profile):
What other cool things do you love about VSCode?